The figures below might beg the question “who cares? There’s never data that clean, the signal would get drowned out by noise for earlier stages”. It’s useful to view this approach as a directional exercise in prioritization, as with most resource allocation approaches as opposed to trying to construct a high-resolution curve.
Recall that ‘Fail Fast’ have two particularly problematic interpretations in the tech startup space:
- Testing ill-researched, gut-feeling ideas
- Labeling inconclusive results as failures for the sake of ‘speed’
My solution to this has been constructing a decision confidence curves.
This post examines constructing one in the most pragmatic way and how it can drive efficient decision making and experimentation at startups.
There are two main steps to constructing a decision confidence curve:
- Define boundary conditions
- Identify points along the curve
The first is much more important, the second is a means to an end.
Define Boundary Conditions
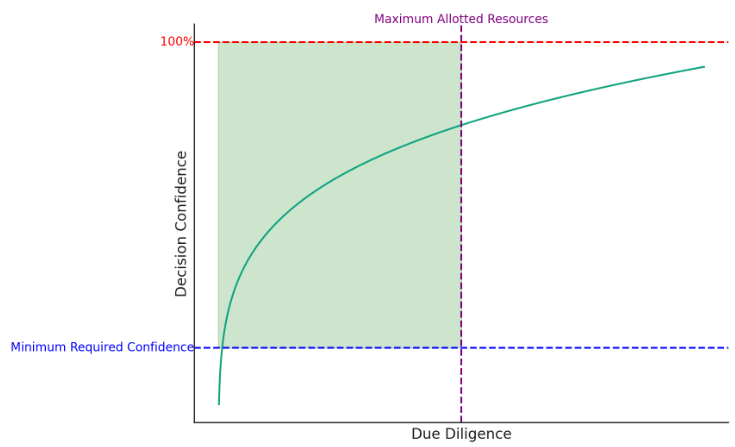
The two boundary conditions can be most easily visualized by identifying the minimum required confidence and the maximum allotted resources.
Intuitively, we can approximate minimum required confidence by considering the initial cost of the decision and the reversion cost of a decision.
For example, a large decision such as market entry for capital intensive businesses, such as telecom, will have a large initial cost ($1m+) and large reversion cost ($1m+) compared to a smaller decision such as changing outreach strategies in SaaS.
Some decisions have a mix, such as pricing, which can have a relatively small initial cost, but have a disproportionately large reversion cost (customers hate may churn if a promotional price is reverted, even with proper communication).
The boundary conditions don’t have to be discrete (it’s in fact impractical / impossible to be discrete in most cases), but rather, t-shirt sizing or relative ranking will work for just about every case.
Identify Points Along the Curve
The decision confidence curve examined so far describes the general trend across an aggregation of decisions, but for singular decisions, it looks more like a staircase function. That is, until each step in due diligence is complete, there is no additional certainty.
There are four categories of data when estimating the curve (or for that matter, in most BizOps scenarios):

The most common data source for each of the four types at startups are as follows:
- market research (external, existing / to be collected)
- historical performance analysis (internal, existing)
- pilot/phased rollout (internal, to be collected)
These are popular options because they have a high ROI, which translates to a relatively steep slope on the decision confidence curve.
One data source worth expanding on is the pilot / phased rollout. Which give a large degree of flexibility because of the freedom in determining the number of phases. In most startup scales, it’ll be 2 phases, one pilot, and pending its results, full scale rollout. In more mature orgs, it may be 3+ phases to mitigate risk a bit further.
Decision Confidence Curves at Scale
At any given point, there might be half a dozen major business decisions that need to be made, from pricing and bundling to sales motions to market entry to corporate development and M&A.
By constructing a rough decision confidence curve, startups can actually abide by the ‘Fail Fast’ mantra while being prudent with resources.
NOTE: One worthwhile nuance when applying decisions curves at scale are dependencies of decisions to one another. Whether two decisions can be run in parallel or one hinges on another. The most practical approach for mitigating this risk across departments, while it may seem obvious, is clear, concise, regular cadence communication and updates.

Leave a comment